


Notes to Editors
About the TomTom Traffic Index
Urban mobility is a key contributor to issues such as climate change, health and economic development and the TomTom Traffic Index has become the barometer of mobility patterns around the world. TomTom’s traffic data, which is powered by 600 million connected devices, is an authoritative indicator of how people move, economic activity levels, global trade and much more. For years, TomTom’s Traffic Index has been used by analysts, corporations and the media to explain a world in flux.
Which data does TomTom use for the Traffic Index?
We source our traffic flow data from over 600 million devices, such as in-dash car navigation, smartphones, personal navigation devices and telematics systems. Each day, TomTom collects from these sources over 61 billion anonymous GPS data points around the world, covering a total distance of more than 3 billion miles driven. This real-time data is archived and accessible as historical data right away. 58 billion driving hours have been accumulated in TomTom’s historical traffic data.
2023 TomTom Traffic Index methodology
-
Travel times and Time lost
For each city (both the city center and the wider metropolitan area), TomTom calculates the average travel time per mile from the time it took to cover the millions of miles driven across the entire network in the year 2023. This makes it possible to estimate the average time taken to cover a typical 6-mile journey in 2023, so that cities can be compared with each other, and year-on-year trends can be assessed. The TomTom Traffic Index determines the optimum travel time (no traffic) and indicates how much these travel times increase on average at different times of day and on different days of the week due to traffic conditions.
-
Costs of driving
TomTom defines the cost of driving as the amount of time, fuel and CO2 used per km or per mile. The cost of driving is the difference between the figures in optimal traffic conditions and the actual average figures, considering the extra amount of average time spent on the road. TomTom collects real-time fuel prices for thousands of stations around the world. To assess fuel costs, TomTom data is based on country-averaged daily pricing over 2022.
-
Emissions Methodology
Emission from traffic is directly proportional to a vehicle’s energy consumption. To raise those consumption models, TomTom used the PHEM (Passenger car and Heavy-duty Emission Model) simulation tool developed by the Graz University of Technology (TU Graz). PHEM calculates the energy required to perform any observed driving maneuvers (speeds, accelerations) from TomTom data for different road profiles, and estimates the resulting emissions, based on the vehicle efficiency, vehicle and energy type (petrol, diesel or electric), as well as speeds.
The TomTom Traffic Index report is available online
At
tomtom.com/Traffic-Index, anyone can discover where their city ranked in 2022, how travel times changed year on year, and how much their driving habits cost.
About TomTom:
Billions of data points. Millions of sources. Hundreds of communities.
We are the mapmaker bringing it all together to build the world’s smartest map. We provide location data and technology to drivers, carmakers, businesses, and developers. Our application-ready maps, routing, real-time traffic, APIs, and SDKs enable the dreamers and doers to shape the future of mobility.
Headquartered in Amsterdam with 3,800 employees around the globe, TomTom has been helping people find their way in the world for over 30 years.
For further information:
Media Relations
Investor Relations
ir@tomtom.com
* on average, for a 6-mile trip driven twice a day (morning and evening) at rush hour
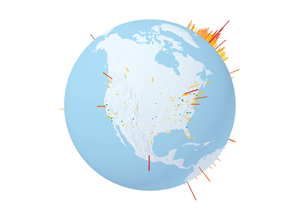
A photo accompanying this announcement is available at https://www.globenewswire.com/NewsRoom/AttachmentNg/ab72c393-8d5d-4269-8129-5c320f9cce48

![]()
Annual TomTom Traffic Index: Major Traffic Trends Shaping Cities Globally in 2023


 Animation, 3D Art and 3D Models")