


- Prices increased by 1% between February and March 2019
- The HPI Forecast indicates prices will increase by 4.8% by March 2020
- Home-price growth is still trending upward, but at a slower pace than a year ago
IRVINE, Calif. — (BUSINESS WIRE) — May 7, 2019 — CoreLogic® (NYSE: CLGX), a leading global property information, analytics and data-enabled solutions provider, today released the CoreLogic Home Price Index (HPI™) and HPI Forecast™ for March 2019, which shows home prices rose both year over year and month over month. Home prices increased nationally by 3.7% year over year from March 2018. On a month-over-month basis, prices increased by 1% in March 2019. ( February 2019 data was revised. Revisions with public records data are standard, and to ensure accuracy, CoreLogic incorporates the newly released public data to provide updated results each month.)
This press release features multimedia. View the full release here: https://www.businesswire.com/news/home/20190507005220/en/
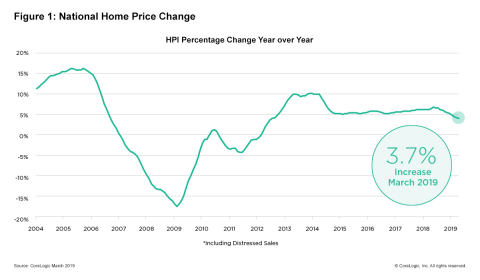
CoreLogic National Home Price Change; March 2019. (Graphic: Business Wire)
Looking ahead, after some initial moderation in early 2019, the CoreLogic HPI Forecast indicates home prices will begin to pick up and increase by 4.8% on a year-over-year basis from March 2019 to March 2020. On a month-over-month basis, home prices are expected to decrease by 0.3% from March 2019 to April 2019. The CoreLogic HPI Forecast is a projection of home prices calculated using the CoreLogic HPI and other economic variables. Values are derived from state-level forecasts by weighting indices according to the number of owner-occupied households for each state.
“The U.S. housing market continues to cool, primarily due to some of our priciest markets moving into frigid waters,” said Dr. Ralph McLaughlin, deputy chief economist at CoreLogic. “But the broader market looks more temperate as supply and demand come into balance. With mortgage rates flat and inventory picking up, we expect more buyers to take advantage of easing housing market headwinds.”
According to the CoreLogic Market Condition Indicators (MCI), an analysis of housing values in the country’s 100 largest metropolitan areas based on housing stock, 35% of metropolitan areas have an overvalued housing market as of March 2019. The MCI analysis categorizes home prices in individual markets as undervalued, at value or overvalued, by comparing home prices to their long-run, sustainable levels, which are supported by local market fundamentals (such as disposable income). Additionally, as of March 2019, 26% of the top 100 metropolitan areas were undervalued, and 39% were at value.
When looking at only the top 50 markets based on housing stock, 40% were overvalued, 16% were undervalued and 44% were at value in March 2019. The MCI analysis defines an overvalued housing market as one in which home prices are at least 10% above the long-term, sustainable level. An undervalued housing market is one in which home prices are at least 10% below the sustainable level.
During the first quarter of 2019, CoreLogic together with RTi Research of Norwalk, Connecticut, conducted an extensive survey measuring consumer-housing sentiment in high-priced markets. The survey respondents indicated high home prices have an impact on high rental prices as well. Nearly 76% of renters and buyers in high-priced markets agreed housing prices in these markets appeared to be driving rental rates up.
“The cost of either buying or renting in expensive markets puts a significant strain on most consumers,” said Frank Martell, president and CEO of CoreLogic. “Nearly half of survey respondents – 44% of renters – cited the cost to rent in high-priced housing markets as the number one barrier to entry into homeownership. This is potentially forcing renters to wait longer to have the necessary down payment in these communities.”
The next CoreLogic HPI press release, featuring April 2019 data, will be issued on Tuesday, June 4, 2019 at 8:00 a.m. ET.
Methodology
The CoreLogic HPI™ is built on industry-leading public record, servicing and securities real-estate databases and incorporates more than 40 years of repeat-sales transactions for analyzing home price trends. Generally released on the first Tuesday of each month with an average five-week lag, the CoreLogic HPI is designed to provide an early indication of home price trends by market segment and for the “Single-Family Combined” tier, representing the most comprehensive set of properties, including all sales for single-family attached and single-family detached properties. The indices are fully revised with each release and employ techniques to signal turning points sooner. The CoreLogic HPI provides measures for multiple market segments, referred to as tiers, based on property type, price, time between sales, loan type (conforming vs. non-conforming) and distressed sales. Broad national coverage is available from the national level down to ZIP Code, including non-disclosure states.
CoreLogic HPI Forecasts<


 Animation, 3D Art and 3D Models")